Example:
P-senor is operated in four steps, namely activation, immobilization, blocking and binding. The related molecules of a specimen are positioned in the first three steps, while in the fourth step a test is conducted on the specimen, giving rise to a standard curve. Two examples are given below.
|
|
|
 |
|
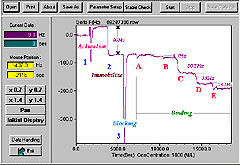
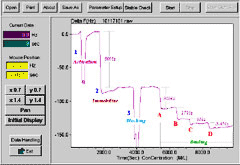
1. Measure the Relative Concentration of Specific Antigens by Means of Known Antibodies
Introduction:
Specimens A, B, C, D and E have different antigens. Not all, but specific, antigens bind to the antibodies embedded in a chip. There is a positive correlation between the degree of binding and the concentration of the antigens.
Method:
PBS buffer (1x) is used as a running buffer. The flow speed is around 70ml/min.
1. Activation:1510 sec- Glutaldehyde 2.5% inject
2. Immobilization:3580 sec-Ab (900ug/ml) dilute 10x inject,ΔF = 99
3. Blocking:5500 sec -Glycine 1M inject
4. Binding:
|
A:
|
7070sec- 60 μg/ml inject,
ΔF =
1.2 |
|
|
B:
|
10200sec-60 μg/ml inject,
ΔF = 4.7 |
|
C:
|
11900sec-60 μg/ml inject,
ΔF = 50.5 |
|
D:
|
14100sec-60 μg/ml inject,
ΔF= 38 |
|
E:
|
16100sec-60 μg/ml inject,
ΔF = 16.3 |
|
|
|
Comment:
During the experiment, chip frequency varies. At position 1, the chip surface is activated by Glutaldehyde. At position 2, there is a high degree of antibody binding, as indicated by a frequency of 99 Hz. At position 3, blocking is followed by the infusion of specimens A, B, C, D and E of the same concentration. The findings are: A: ΔF=1.2, B: ΔF=4.7, C: ΔF=50.5, D: ΔF=38, and E: ΔF=16. Hence, the ranking of the degree of purity of the five specimens is C>D>E>B>A. It is determined that specimen A does not contain any antigens that correspond to the antibodies, as its binding is too little (ΔF=1.2).
|
|
|
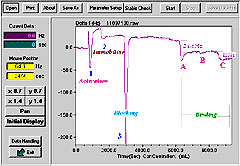
2. Measure the Interaction of Base Pairs
Introduction:
Fix Avidin to the chip surface, pour Biotin-attached 30mer Cytosine onto the Avidin-embedded chip surface, then pour Biotin-attached 20mer Cytosine onto the Avidin-embedded chip surface, and finally pour 20mer Guanine onto the Avidin-embedded chip surface.
Method:
PBS buffer (1x) is used as a running buffer. The flow speed is around 70ml/min.
1. Activation:670sec - Glutaldehyde 2.5%
2. Immobilization:1350sec- 100ug/ml Avidin inject
3. Blocking:2770sec - Glycine 1M inject
4. Binding:
|
A:
|
6080sec- Biotin-30Cmer inject,
ΔF = 24.6 |
|
|
B:
|
7230sec- Biotin-20Cmer inject,
ΔF = 0.3
|
|
C:
|
8430sec- 20Gmer inject,
ΔF= 12 |
|
|
|
Comment:
This experiment is similar to the sandwich mode of ELISA for the reason that immobilization is done twice. The first immobilization is to fix Avidin to the chip surface. With the second immobilization, Biotin-30Cmer is fixed to the chip surface (at point A), leading to ΔF=24.6. Afterward Biotin-20Cmer is fixed to the chip surface (at point B), and ΔF=0.3, showing that all Avidin binding sites are fully occupied by the Biotin molecules attached to Biotin-30Cmer infused at point A previously and thus there is no more Avidin binding sites for the Biotin-20Cmer molecules that come later. Finally, 20Gmer is poured onto the Avidin-embedded chip surface at point C, and ΔF=12, indicating the C-G binding of base pairs.
|
|
|
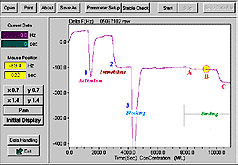
3. Detect Antigens of Extremely Low Concentration with P - sensor 2000
Introduction:
This experiment is designed to evaluate the detection limit of P - sensor 2000 and is conducted on the commercial Mouse IgG and anti - Mouse IgG.
Method:
PBS buffer (1x) is used as a running buffer. The flow speed is around 70ml/min.
1. Activation:950 sec- Glutaldehyde 2.5% inject
2. Immobilization:2700 sec-Mouse IgG (105ug/ml) inject,ΔF = 123
3. Blocking:3900 sec -Glycine 1M inject
4. Binding:
|
A:
|
7600sec-anti-Mouse IgG 1μg/ml inject,ΔF = 8Hz |
|
|
B:
|
8600sec-anti-Mouse IgG 0.1 ng/ml inject,ΔF = 1.5Hz |
|
C:
|
9750sec-anti-Mouse IgG 10 ug/ml inject,ΔF=50Hz |
| |
|
|
|
|
|
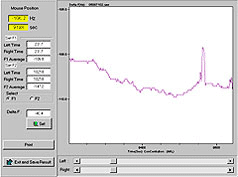
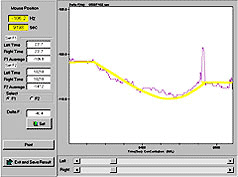
Comment:
At point A, ΔF=8Hz; at point B, ΔF=1.5Hz; and at point C, ΔF=50Hz. Figure "03_antiMIgG_02" is the enlargement (by analytic software) of the part of the oscillation curve at point B. Figure "03_antiMIgG_03" illustrates the oscillation trend of its frequencies, and shows that ΔF=1.5Hz. With the drawing functions of Excel, it is proved that the above-mentioned points are linearly correlated, with R2 over 0.9.
|
|
|
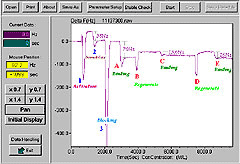
4. Detect Antibodies in Blood Specimens for Helicobacter Pylori Directly
Introduction:
Helicobacter Pylori, Gram (-) bacteria, infect half of the adults in the world. Helicobacter Pylori is accountable for gastric ulcer and gastritis. In this experiment, H. pylori antigens are fixed onto a chip, so as to perform a test right on the diluted blood specimens taken from patients and healthy persons. NaOH solution and HCl solution are used as the regenerating buffer, so that the chip can be recycled.
Method:
PBS buffer (1x) is used as a running buffer. The flow speed is around 70ml/min.
1. Activation:500 sec-Glutaldehyde 2.5% inject
2. Immobilization:1160 sec- H.pylori Ag(100ug/ml) inject,ΔF = 38 Hz
3. Blocking:1880 sec-Glycine 1M inject
4. Binding:
|
A:
|
2770 sec- dilute 1000x (A) serum inject,ΔF = 70 Hz
Regenerate:
|
|
|
B:
|
3690 sec-30mM NaOH inject,
Binding:
|
|
C:
|
5220sec- dilute 1000x (C) serum inject,
Regenerate:
|
| D: |
7250sec- 30mM HCL inject,
Binding:
|
| E: |
8440sec- dilute 1000x (E) serum inject,ΔF = 26 Hz |
|
|
|
Comment:
Findings of this experiment are: ΔF=70 for specimen A, ΔF=13.6 for specimen B, and ΔF=26 for specimen C, showing that specimen A was taken from a patient with gastric ulcer, specimen C from a healthy person, and specimen E contained H. pylori antibodies of an amount slightly more than the normal value but the patient did not have any symptom. Hence, P-sensor2000 is as effective as, but (because of chip recycling) faster and cheaper than, a traditional Hp test
|
|
|
5.Measure the Change in the Concentration of Antigens Following Medication
Introduction:
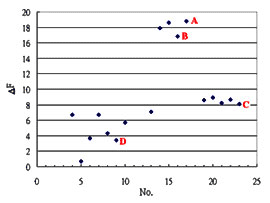
Coxsackie virus invades human brains and causes meningitis. The experiment is conducted on the CSF specimens taken from three groups of guinea pig (four of a control group, six of an infection group and seven of a treatment group). The concentration of the antigens in the CSF specimens is measured by means of the coX (Coxsackie Ab) fixed onto a chip. With the data acquired, a diagram is drawn so as to identify the discrepancy among the three groups.
Method:
PBS buffer (1x) is used as a running buffer. The flow speed is around 70ml/min.
1. Activation:470 sec -Glutaldehyde 2.5% inject
2. Immobilization:1600 sec-Ab(10ug/ml) inject,ΔF = 80Hz
3. Blocking:3600 sec-Glycine 1M inject
4. Binding:
|
A:
|
5250sec-dilute 1000x M22 inject
,ΔF = 19 Hz
|
|
|
B:
|
6250sec-dilute 1000x inject,
ΔF = 17 Hz |
|
C:
|
7050sec-dilute 1000x inject,
ΔF = 8 Hz |
| D: |
8200sec-dilute 1000x inject,
ΔF= 3.4 Hz |
| |
|
| |
|
Comment:
Although the data shown in this example merely amounts to part of the data about the specimens, it gives rise to a diagram done by Excel, telling the difference in the relative concentration among the three groups and thus differentiating one group from another.
|
|
|